
To learn more about this challenge you can visit the official page of the NASA Space Apps Covid-19 Challenge.
The contents of this post where originally contained within a jupyter notebook which is available for download on Github
Believing that the most common definition of population density (population of country / area of country) was not the best metric for how close people are living in a given country, we wanted to find a way to calculate a new and improved population density for each country. After observing several nighttime images using Worldview with the VIIRS Nighttime Imagery layer we came to the conclusion that -in most countries- more people live in or around urban centers (indicated by higher light emittance in these areas) and thus instead of using the overall area of a country to calculate the density, we could use a corrected value based on what part of the country is active at night.
For finding the white pixel percentage and doing basic image manipulation we are using the OpenCV (cv2) library:
import cv2
import matplotlib.pyplot as plt
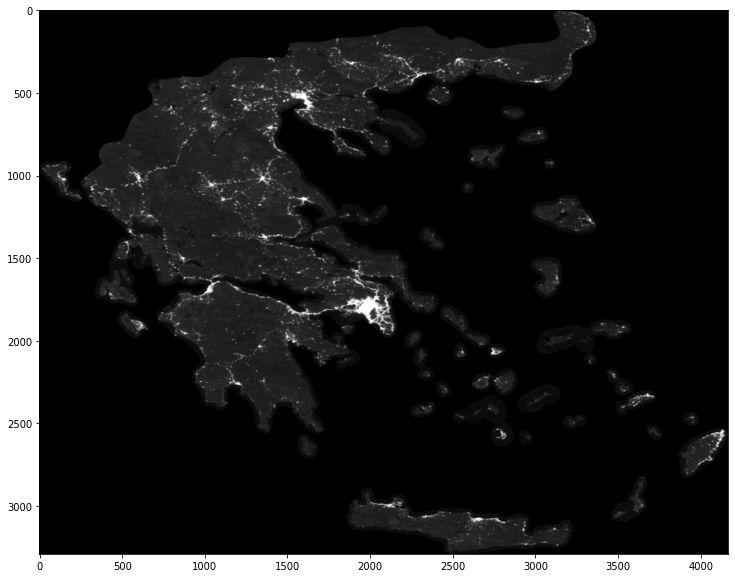
We first load the image we want to test which we have previously captured using Worldview and cropped to only include the country we are interested in (e.g. Greece):
img = cv2.imread('Images/Greece/greece_crop.png')
gray = cv2.cvtColor(img, cv2.COLOR_BGR2GRAY) # get a grayscale only version of the image
This is what our input image looks like:
Here, we set the variable that dictates which colors should be considered white and which black (for example here all pixels that are over 51 (20% white) are considered light pixels). This is finely tuned for each image as it is highly dependent on weather conditions:
threshold = 51
height, width = gray.shape[:2]
total, light = 0, 0
Iterating over each pixel of the image we count the light pixels (pixels that are over the threshold) and also change the color of each detected light pixel to red, something that we use to determine if our threshold is correct or not.
for i in range(0, height):
    for j in range(0, width):
        val = gray.item(i, j)
        if val: # this is not a cropped pixel
            total += 1
            if val >= threshold: # this is a light pixel
                light += 1
                # Set the color of detected pixel to red
                img.itemset((i,j,2), 0)
                img.itemset((i,j,1), 0)
                img.itemset((i,j,0), 255)
Finally our program returns the percentage of light pixels in the image (excluding the totally black parts which are the parts we have manually cropped out):
print("{}/{} ({:.3f}%)".format(light, total, light/total * 100))
463511/4126770 (11.232%)
As you can see only 11% of Greece seems to be active during the nighttime!
To see if our threshold is correct we examine the output image to see if all lights (or at least the ones we can detect) are lit up:
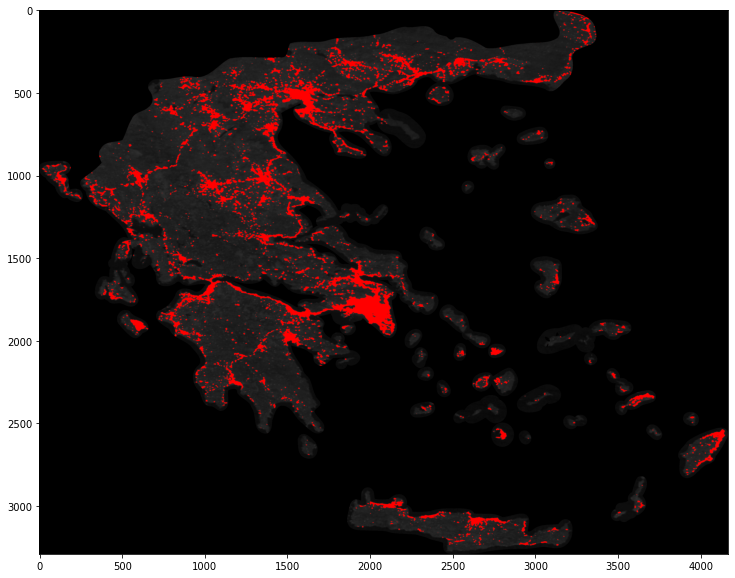
In this example we can see how the capital (Athens) and the other large Greek cities (like Thessaloniki, Patras and Larissa) appear way redder than others and can even be spotted without knowledge of their precise location beforehand (give it a try). We can also spot the most popular islands (e.g. Santorini and Mykonos) just by examining how much light they emit.
Choosing a correct threshold value
The biggest problem with a method like this is that slight changes to the threshold value make a huge difference in the final percentage of light pixels detected and objectively choosing the proper value for it does not seem possible. To see how big the effect of the threshold value is, we can plot the resulting percentage against it, as seen below:
thresholds = [0 for i in range(0, 256)]
total = 0
for i in range(0, height):
    for j in range(0, width):
        val = gray.item(i, j)
        if val:
            total += 1
            for x in range(0, val + 1):
                thresholds[x] += 1
thresholds = [round(light / total * 100, 3) for light in thresholds]
import matplotlib.pyplot as plt
fig = plt.figure()
plt.plot(range(0, 256), thresholds)
plt.xlabel('Threshold', fontsize=12)
plt.ylabel('Percentage of light pixels', fontsize=12);

The percentage drops almost vertically around a threshold of about 25 and even though we can confidently say that, in this case, the threshold should be between 45 and 55 by observing the output images, the percentage difference between those values is pretty substantial. This showcases what we feared from the beginning: without a set method for finding the correct threshold value our results are pretty much useless.

Leave a Comment
Your email address will not be published. Required fields are marked *